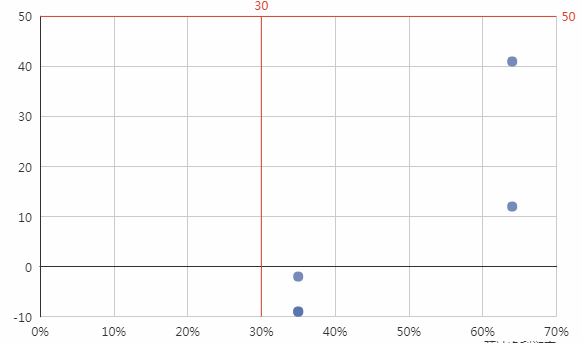
用echarts写了个简单的散点图

该散点图设置了两条标准线:x=10 和 y=10
具体代码:
1 option = { 2 title : { 3 left: 'center', 4 show: false 5 }, 6 grid: { 7 left: '3%', 8 right: '5%', 9 bottom: '5%',10 containLabel: true11 },12 tooltip : {13 showDelay : 0,14 formatter : function (params) { //格式化鼠标移上去显示内容样式15 if (params.value.length > 1) {16 return params.value[2] ;17 }18 19 },20 backgroundColor: '#fff', //气泡背景色21 textStyle: { //文字样式22 color: '#333'23 },24 borderColor:'#CBCBCB',//气泡边框颜色25 borderWidth:1,//气泡边框款26 extraCssText: 'box-shadow: 0 0 3px rgba(0, 0, 0, 0.3);'//API中的让气泡带有阴影的效果27 },28 xAxis : [29 {30 type : 'value',31 scale:false,32 axisLabel : {33 formatter: '{value}%'34 },35 axisTick:{ //刻度线样式36 show: false37 }38 }39 ],40 yAxis : [41 {42 type : 'value',43 scale:false,44 axisLabel : {45 formatter: '{value}'46 },47 axisTick:{48 show: false49 }50 }51 ],52 series : [53 {54 type:'scatter',55 data: [56 [10.0, 8.04,'point1'],57 [8.0, 6.95,'point2'],58 [13.0, 7.58,'point3'],59 [9.0, 8.81,'point4'],60 [11.0, 8.33,'point5']61 ],62 itemStyle:{ //当前数据的样式63 normal:{color:'#556EAA'}64 }65 },66 {67 type:'scatter',68 data: [69 [10.0, 11.2,'point6'],70 [12.5, 16.3,'point7'],71 [14.1, 10.2,'point8'],72 [11.0, 12.0,'point9'],73 [11.0, 13.1,'point10']74 ],75 itemStyle:{76 normal:{color:'#DB442D'}77 },78 markLine : { //标记线设置79 lineStyle: {80 normal: {81 type: 'solid'82 }83 },84 symbolSize:0,//控制箭头和原点的大小、官方默认的标准线会带远点和箭头85 data : [ //设置两条标准线——x=10 和 y=1086 { xAxis: 10 },87 { yAxis: 10 }88 ]89 }90 }91 ]92 };93 94